paintパッケージでデータフレームを見やすく表示
##はじめに
ちょっと更新期間が空いてすみません!お久しぶりです! Dr. Stoneがジャンプ本誌で完結したということらしいので、1巻から発売済み最新刊の25巻までを一気読みしていたらこんなことになっちゃいました😅
今回はリハビリがてら軽めの話題で、データフレームをプレビューする方法について話したいと思います!
##まずはpaint()関数をご覧ください
R界隈をネットサーフィンしていたら興味深いパッケージを見つけました!
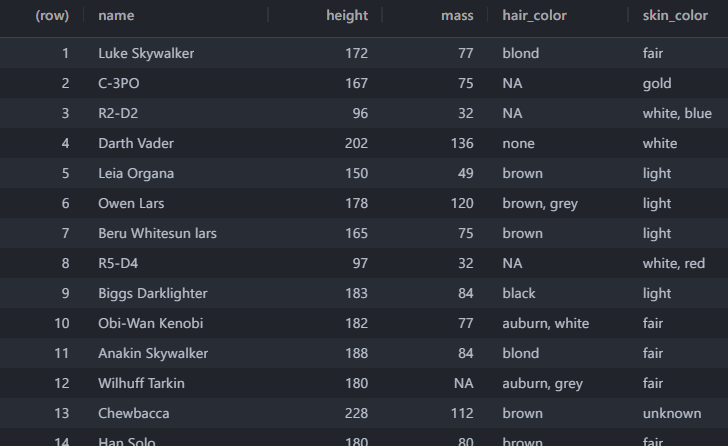
paintパッケージを使用してデータフレームをプレビューすると、このような感じで各列の先頭数個の値が色分けされた状態で表示されます。 動作は極めて高速なので、ぱっと確認したいときには便利そうです!
pacman::p_load(tidyverse, paint)
starwars %>% paint()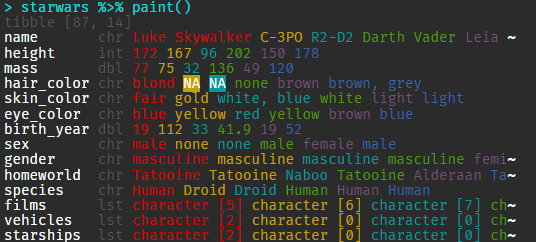
###使い方
インストールは公式のレポジトリの説明によると、r-universeから行うそうです。CRANへの登録はまだのようです。
install.packages(
    "paint",
    repos = c(mm = "https://milesmcbain.r-universe.dev", getOption("repos"))
)普通に使用するときはpaint()関数を使用します。
starwars %>% paint()いちいちpaint()関数を使用するのが面倒な場合はmask_print()関数を使用すれば、以後のプレビューはすべてpaint()関数でマスクされることになります。
paint::mask_print()
## {paint} masked print.data.frame
## {paint} masked print.tbl_dfやっぱりマスクしたくないなーと思ったら、unmask_print()で解除することもできます!
paint::unmask_print()
## {paint} unmasked print.data.frame
## {paint} unmasked print.tbl_df###色パターンを変えることもできる
カラーコードを指定すれば色パターンを自分好みに変えることもできるそうです!
# 公式の使用例
pacman::p_load(viridisLite)
pacman::p_load(crayon, paint)
my_magma <- lapply(viridisLite::magma(6), crayon::make_style)
options(paint_palette = my_magma)
paint(mtcars)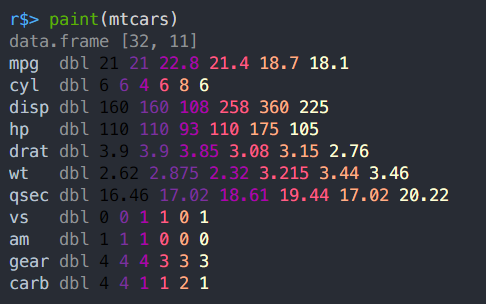
# わたしの大好きなカラーパターンAAAS
# ggsciパッケージはinstall.package:()で導入可能です
my_pal <- lapply(ggsci::pal_aaas()(6), crayon::make_style)
options(paint_palette = my_pal)
paint(mtcars)
###paint関数の設定を保持し続ける
個人的にpaintはカラフルでいいなーと思ったので(多分一ヶ月後には飽きて戻すけど)、今回の設定をR起動時自動読み込みされるように設定しました。
カラーコードのパターンには最近のマイブームテーマ、catppuccinのパステルカラーを使用してみました。
library(paint)
pal_catppuccin <- lapply(
    c('#F28FAD', '#ABE9B3', '#FAE3B0', '#96CDFB', '#F5C2E7', '#89DCEB'),
    crayon::make_style
)
options(paint_palette = pal_catppuccin)

# 表示するとこんな感じ
paint::paint(starwars)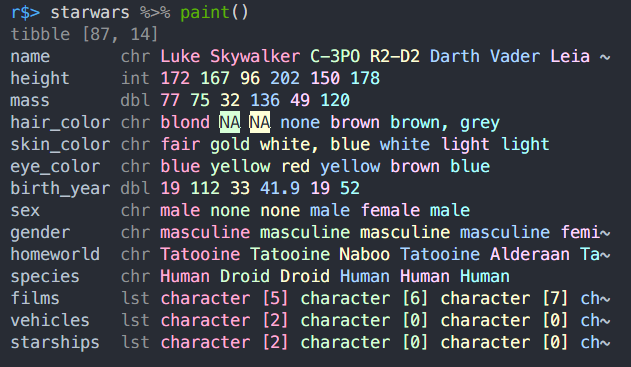
optionsまでを.Rprofileに記述しておくことで、R起動時に自動的に読み込ませることができます♪
通常、.Rprofileファイルはホーム直下に存在しますが、お使いのOSによっても変わってくるかもしれません。どこに置いたらよいか自信がない場合はusethis::edit_r_profile()関数を使うといいと思います!
##ほかのデータフレームのプレビュー方法
実はここからの内容がメインかもしれません笑 今回紹介したpaint()もまあまあ見やすいとは思いますが、ほかの方法を知っておくのもいいと思います。今から紹介する内容は意外と知られていないことが多いので、これを機に私が知る方法をすべてご紹介しようと思います!
###絶対にやってはいけないprint(data.frame)
安直にdata.frameを出力するのもいいかもしれませんが、データが大きくなるとターミナルがドバーっと埋め尽くされてしまいます。こうなっては列名を確認することすらかないません。プレビュー方法としては悪手でしょう。
初心者向けの解説サイトでは「head()関数で先頭数行を表示しましょう」なんてことも書かれてますが、私はちょっと確認したいだけなのにhead()を書くのは億劫に感じますね・・・・
print(iris)
head(iris)###View()関数を使う
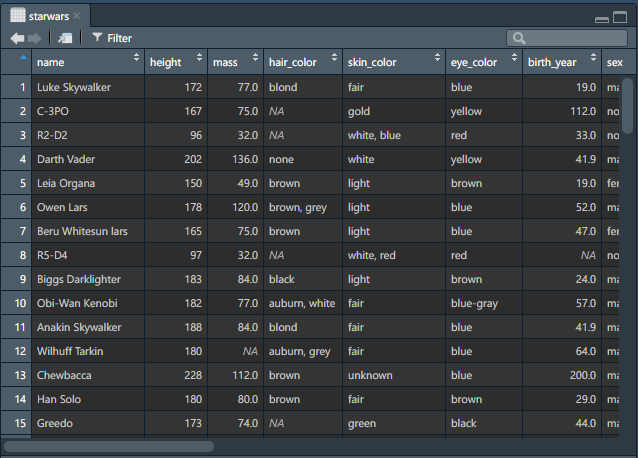
割としっかりめにデータをプレビューしたい場合にはView()関数を使うのもいいと思います。 10回に1回くらいは私もこの方法を使っています。
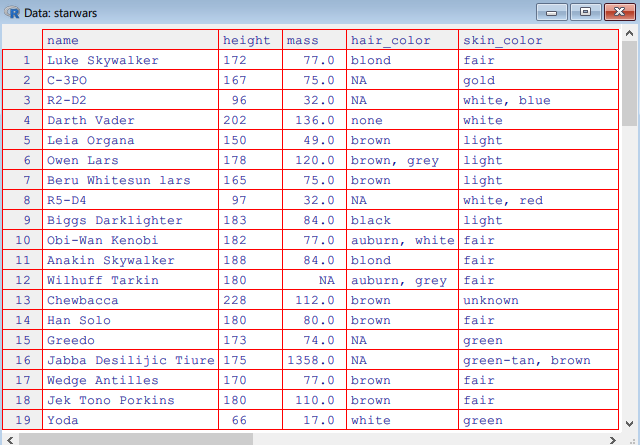
View()関数は基本的にどの環境でもデータフレームを非常に見やすく表示してくれる関数です。
View(starwars)ターミナルからRを起動して、GUIの操作ができないときにだけView関数は使用不可です。(ディスプレイポートに接続できない場合)
Rstudioの場合: RstudioではEnvironment中のデータプレビューボタンがView()関数を実行するのと同じアクションになります。
Visual Studio Codeの場合:
Rconsoleの場合:
###tibbleを使う
tidyverse関数を使用している場合、出力がほぼ間違いなくtibbleに変換されます。そのため、皆様は気づかずにtibbleの恩恵を受けているかもしれません。 私は専らこの方法を使ってます。
tibbleはprint()するか、普通にオブジェクト自体を実行すると、自動的に要約された情報を観ることができます。
r$> as_tibble(starwars)
# # A tibble: 87 × 14
#    name   height  mass hair_color skin_color eye_color birth_year sex   gender homeworld species
#    <chr>   <int> <dbl> <chr>      <chr>      <chr>          <dbl> <chr> <chr>  <chr>     <chr>
#  1 Luke …    172    77 blond      fair       blue            19   male  mascu… Tatooine  Human
#  2 C-3PO     167    75 NA         gold       yellow         112   none  mascu… Tatooine  Droid
#  3 R2-D2      96    32 NA         white, bl… red             33   none  mascu… Naboo     Droid
#  4 Darth…    202   136 none       white      yellow          41.9 male  mascu… Tatooine  Human
#  5 Leia …    150    49 brown      light      brown           19   fema… femin… Alderaan  Human
#  6 Owen …    178   120 brown, gr… light      blue            52   male  mascu… Tatooine  Human
#  7 Beru …    165    75 brown      light      blue            47   fema… femin… Tatooine  Human
#  8 R5-D4      97    32 NA         white, red red             NA   none  mascu… Tatooine  Droid
#  9 Biggs…    183    84 black      light      brown           24   male  mascu… Tatooine  Human
# 10 Obi-W…    182    77 auburn, w… fair       blue-gray       57   male  mascu… Stewjon   Human
# # … with 77 more rows, and 3 more variables: films <list>, vehicles <list>, starships <list>
あんまり設定することはないと思いますが、表示する行数を指定することも可能です。
as_tibble(starwars) %>% print(n = 1)
## # A tibble: 87 × 14
##   name      height  mass hair_color skin_color eye_color birth_year sex   gender
##   <chr>      <int> <dbl> <chr>      <chr>      <chr>          <dbl> <chr> <chr>
## 1 Luke Sky…    172    77 blond      fair       blue              19 male  mascu…
## # … with 86 more rows, and 5 more variables: homeworld <chr>, species <chr>,
## #   films <list>, vehicles <list>, starships <list>
同じように列数もwidth引数で指定可能です。
as_tibble(starwars) %>% print(width = 1)
## # A
## #   tibble:
## #   87
## #   ×
## #   14
## # … with 77 more rows, and 14 more variables: name <chr>, height <int>, mass <dbl>, hair_color <chr>, skin_color <chr>, eye_color <chr>, birth_year <dbl>, sex <chr>, gender <chr>, homeworld <chr>, species <chr>, films <list>, vehicles <list>, starships <list>###dplyr::glimpse
dplyrパッケージにはデータフレームをプレビューするための関数、glimpse()が用意されています。 glimpseは今回紹介したpaintによく似た形式のプレビュー方法で、列がずらずらっと並ぶような形になっています。列数が多い場合で、「どんな変数がこのデータにはあるのかなー?」と思ったときには便利ですね。
しかし、glimpseは色分けが一切ないため、データの紐付けを理解することが困難です。
glimpse(starwars)
## Rows: 87
## Columns: 14
## $ name       <chr> "Luke Skywalker", "C-3PO", "R2-D2", "Darth Vader", "Leia Or…
## $ height     <int> 172, 167, 96, 202, 150, 178, 165, 97, 183, 182, 188, 180, 2…
## $ mass       <dbl> 77.0, 75.0, 32.0, 136.0, 49.0, 120.0, 75.0, 32.0, 84.0, 77.…
## $ hair_color <chr> "blond", NA, NA, "none", "brown", "brown, grey", "brown", N…
## $ skin_color <chr> "fair", "gold", "white, blue", "white", "light", "light", "…
## $ eye_color  <chr> "blue", "yellow", "red", "yellow", "brown", "blue", "blue",…
## $ birth_year <dbl> 19.0, 112.0, 33.0, 41.9, 19.0, 52.0, 47.0, NA, 24.0, 57.0, …
## $ sex        <chr> "male", "none", "none", "male", "female", "male", "female",…
## $ gender     <chr> "masculine", "masculine", "masculine", "masculine", "femini…
## $ homeworld  <chr> "Tatooine", "Tatooine", "Naboo", "Tatooine", "Alderaan", "T…
## $ species    <chr> "Human", "Droid", "Droid", "Human", "Human", "Human", "Huma…
## $ films      <list> <"The Empire Strikes Back", "Revenge of the Sith", "Return…
## $ vehicles   <list> <"Snowspeeder", "Imperial Speeder Bike">, <>, <>, <>, "Imp…
## $ starships <list> <"X-wing", "Imperial shuttle">, <>, <>, "TIE Advanced x1",…###data.table
私はdata.tableパッケージをほとんど使わないのであんまり詳しくないのですが、data.table型もtibbleと同じように独自のフォーマットでプレビューしてくれます。
data.tableはデータフレーム処理を高速に行うためのパッケージです。tidyverse系のtibbleとは距離を置いた存在です。
pacman::p_load(data.table)
as.data.table(iris)
## data.table [150, 5]
## Sepal.Length dbl 5.1 4.9 4.7 4.6 5 5.4
## Sepal.Width  dbl 3.5 3 3.2 3.1 3.6 3.9
## Petal.Length dbl 1.4 1.4 1.3 1.5 1.4 1.7
## Petal.Width  dbl 0.2 0.2 0.2 0.2 0.2 0.4
## Species      fct setosa setosa setosa setosa setosa setosa
data.tableのオプションはマニュアルをそのままのせておきます。
Usage
  ## S3 method for class 'data.table'
print(x,
    topn=getOption("datatable.print.topn"),             # default: 5
    nrows=getOption("datatable.print.nrows"),           # default: 100
    class=getOption("datatable.print.class"),           # default: FALSE
    row.names=getOption("datatable.print.rownames"),    # default: TRUE
    col.names=getOption("datatable.print.colnames"),    # default: "auto"
    print.keys=getOption("datatable.print.keys"),       # default: FALSE
    trunc.cols=getOption("datatable.print.trunc.cols"), # default: FALSE
    quote=FALSE,
timezone=FALSE, ...)##まとめ
ということで今回はpaintパッケージの紹介とともに、いろいろな方法でデータフレームをプレビューする方法を紹介しました!
Rプログラミングをするということは即ちデータフレーム操作です。データフレームをサッとかっこ良くプレビューできれば、いつもの解析も楽しくできるんじゃないでしょうか。paint()関数、よかったら使ってみてください😀